Equity is at the heart of the Chicago Region Trees Initiative’s goals.
CRTI has identified where canopy is low and where related challenges, including increased flooding, poor air quality, higher surface temperatures, and increased health challenges, are exacerbated. CRTI has an ongoing process to address these issues in our most vulnerable communities.
In many cases, current challenges and vulnerabilities are the result of long-standing disparity and discrimination. CRTI developed an interactive map to help us understand where needs are greatest and where we can work collectively to reduce this disparity. Redlining began in 1934 and was slowly halted through legislation and community activism in the 1960’s, but it continues to plague the Chicago region today. Please take a moment to read a short explanation of this practice and its effect on our region’s canopy cover.
As we think about the lasting impacts of systemic racism on the distribution of trees and green spaces across our region, it is critical to remember that access to green space has measurable health benefits that are currently relevant. Trees speed hospital recovery, reduce stress levels, and are correlated with lower rates of death from pulmonary and cardiovascular disease. You can read more of the scientifically backed benefits of trees here. Many neighborhoods across our region do not have equal access to green space and so these “green benefits” are not evenly available.
We hope you will be inspired to work with us to provide equitable urban forestry benefits to the entire Chicago region. We cannot change the past but we can change our future. Each of us can work to improve equity and reduce disparity in our region.
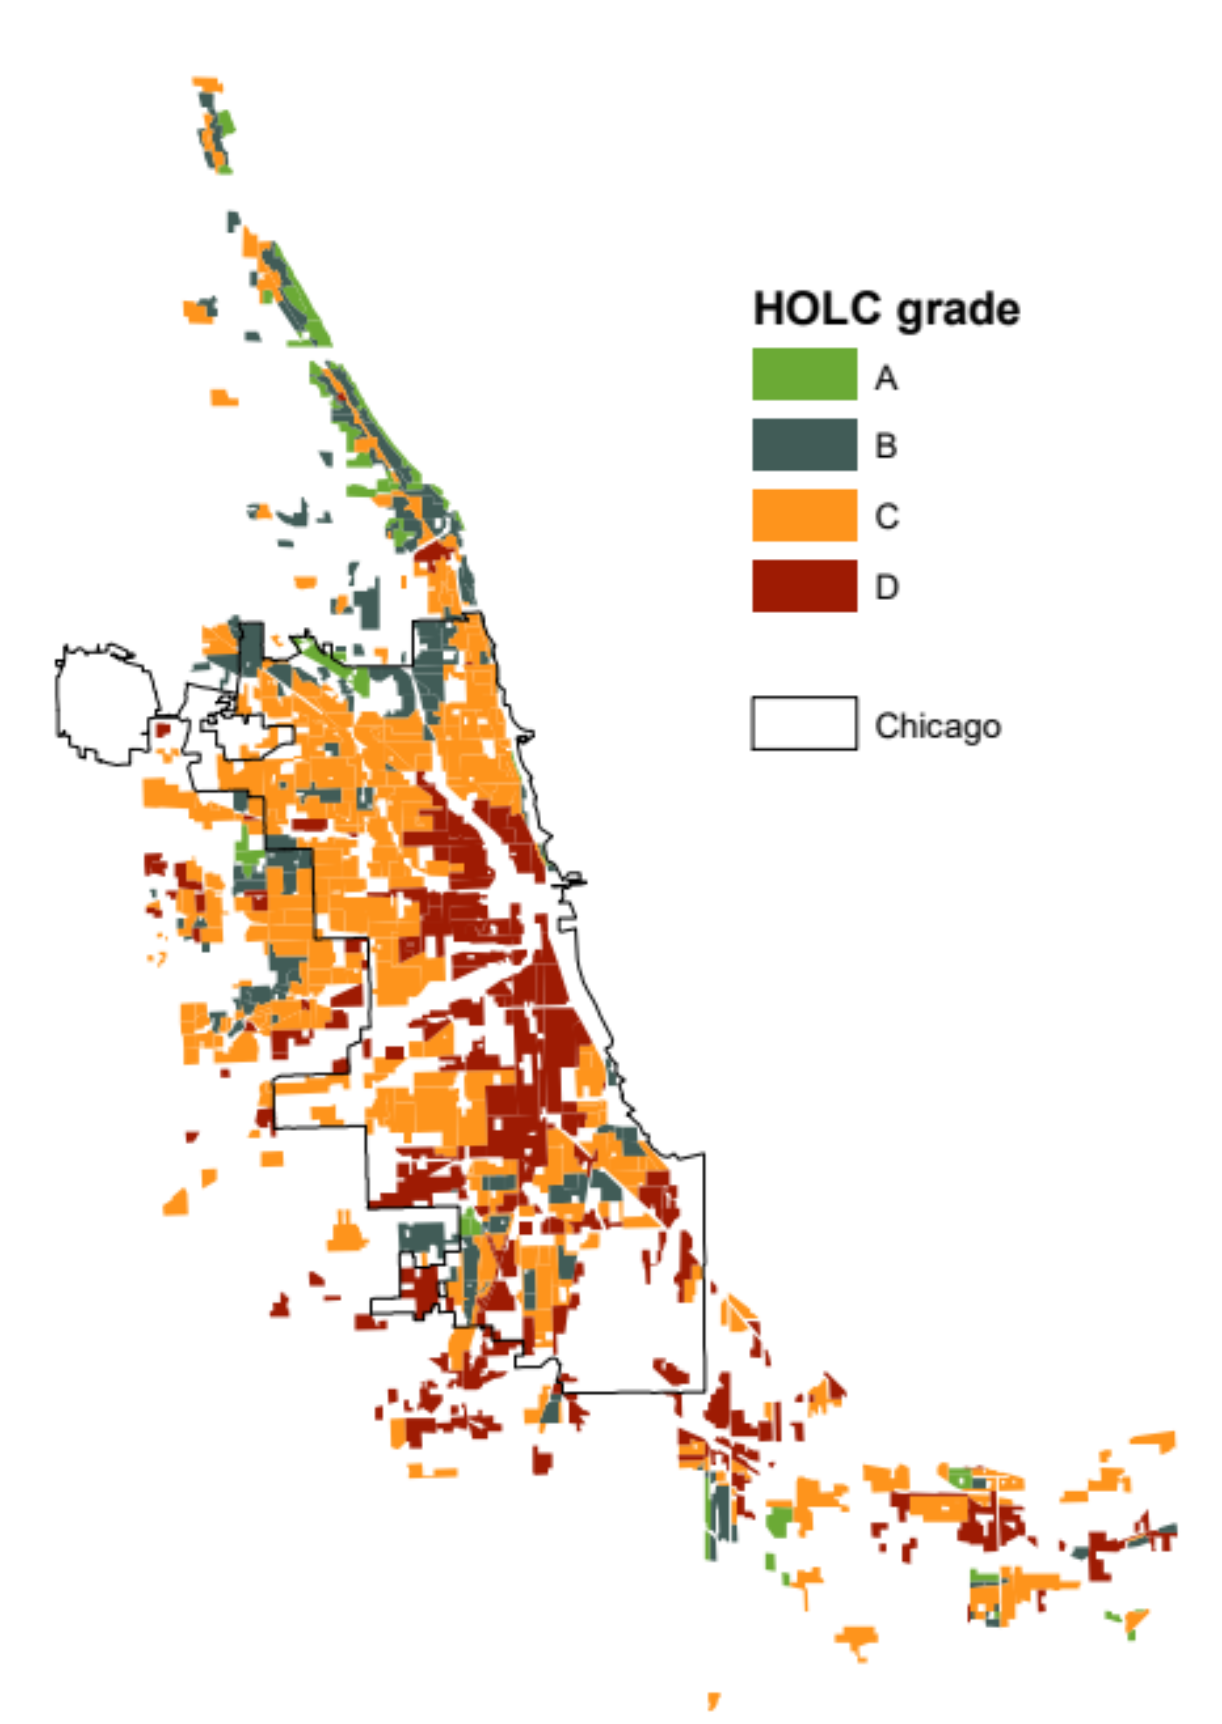
In 1934, the federal government set up the National Housing Act.
The program provided low-cost loans that encouraged home ownership during the great depression. The Home Owner’s Loan Corporation (HOLC) was tasked with rating the risk associated with the loans. They divided neighborhoods into four categories, and race was explicitly used for the rankings:
- A: Safest, predominately white and US born with the newest structures,
- B: Still desirable, slightly older buildings, predominately white,
- C: Declining, some foreign born people, older buildings,
- D: Hazardous, mostly black and foreign people, oldest housing stock.
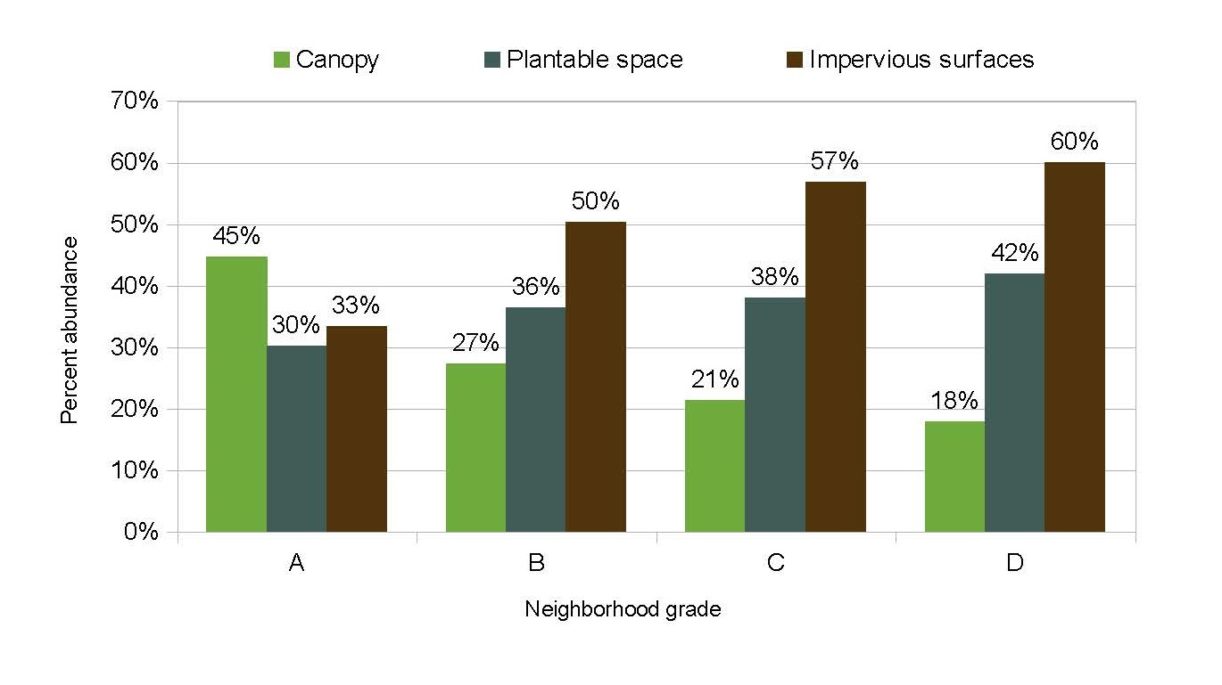
The D rated neighborhoods were colored red on these maps, giving rise to the term “redlining.” These neighborhoods did not receive loans, and even though the practice was officially ended in the 1960’s by the Fair Housing Act, the impacts can still be seen today. Nation-wide, formerly redlined neighborhoods have lower home values, higher temperatures, and half as many trees as affluent neighborhoods. In Chicago, there were very few grade A neighborhoods, but they look very different from the D ranked areas. On average, they have 27% more canopy and far less impervious surface. On a more positive note, formerly redlined neighborhoods have the most space to expand the canopy (plantable space), meaning there is an opportunity to amend the canopy aspect of these historic wrongs.
For more information on the subject, check out this NPR article and video on redlining. It has some great links to current research and further delineates redlining’s current impacts on cities.
Figure 1: HOLC grading of Chicago neighborhoods. The majority of the city was considered to be hazardous or declining, with some higher ranked neighborhoods along the north branch of the Chicago River and near Beverly. Many of the lake-side neighborhoods to the north of the city were also ranked A.